THÔNG SỐ KỸ THUẬT CHÍNH
- Băng thông 100MHz, 200MHz
- 2 hoặc 4 kênh Analog
- 1GS/s trên mọi kênh
- Lưu trữ 1 Megapoint trên toàn kênh
- Tốc độ lưu mẫu : 5000/s
- Kết nối USB
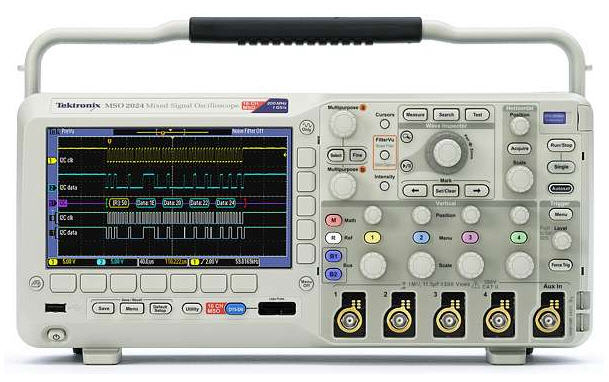
Mixed Signal Oscilloscopes
MSO2000 Series, DPO2000 Series
Features & BenefitsKey Performance Specifications
Ease of Use Features
Connectivity
Optional Serial Triggering and Analysis
Mixed Signal Design and Analysis (MSO Series)
Feature-rich Tools for Debugging Mixed Signal DesignsOffering up to 200 MHz bandwidth and 1 GS/s sample rate, the MSO/DPO2000 Mixed Signal Oscilloscope Series delivers advanced debug features at an entry-level price. With up to 20 channels for analyzing analog and digital signals, you can quickly find and diagnose problems in complex designs. To capture long windows of signal activity while maintaining fine timing resolution, the MSO/DPO2000 offers a deep record length of 1 Mpoints standard on all channels. With Wave Inspector® controls for rapid waveform navigation and automated serial and parallel bus analysis, the MSO/DPO2000 Oscilloscope Series from Tektronix provides the feature-rich tools you need to simplify and speed debug of your complex design. Comprehensive Features Speed Every Stage of DebugThe MSO/DPO2000 Series offers a robust set of features to speed every stage of debugging your design – from quickly discovering an anomaly and capturing it, to searching your waveform record for the event and analyzing its characteristics and your device’s behavior. 
Discover – A waveform capture rate of 5,000 wfm/s maximizes the probability of capturing elusive glitches and other infrequent events. DiscoverTo debug a design problem, first you must know it exists. Every design engineer spends time looking for problems in their design, a time-consuming and frustrating task without the right debug tools. The MSO/DPO2000 Series offers complete visualization of signals, providing fast insight into the real operation of your device. A waveform capture rate of 5,000 waveforms per second enables you to see glitches and other infrequent transients quickly, revealing the true nature of device faults. A digital phosphor display with intensity grading shows the history of a signal’s activity by intensifying areas of the signal that occur more frequently, providing a visual display of just how often anomalies occur. 
Capture – Triggering on a specific transmit data packet going across an RS-232 bus. A complete set of triggers, including triggers for specific serial packet content, ensures you quickly capture your event of interest. CaptureDiscovering a device fault is only the first step. Next, you must capture the event of interest to identify root cause. The MSO/DPO2000 Series provides a complete set of triggers – including runt, logic, pulse width/glitch, setup/hold violation, serial packet, and parallel data – to help quickly find your event. With up to a 1 Mpoint record length, you can capture many events of interest, even thousands of serial packets, in a single acquisition for further analysis while maintaining high resolution to zoom in on fine signal details. From triggering on specific packet content to automatic decode in multiple data formats, the MSO/DPO2000 Series provides integrated support for a broad range of serial buses – I2C, SPI, CAN, LIN, and RS-232/422/485/UART. The ability to decode up to two serial and/or parallel buses simultaneously means you gain insight into system-level problems quickly. To further help troubleshoot system-level interactions in complex embedded systems, the MSO2000 Series offers 16 digital channels in addition to its analog channels. Since the digital channels are fully integrated into the oscilloscope, you can trigger across all input channels, automatically time-correlating all analog, digital, and serial signals. 
Search – I2C decode showing results from a Wave Inspector search for Address value 50. Wave Inspector controls provide unprecedented efficiency in viewing and navigating waveform data. SearchFinding your event of interest in a long waveform record can be time consuming without the right search tools. With today’s record lengths pushing to a million data points, locating your event can mean scrolling through thousands of screens of signal activity. The MSO/DPO2000 Series offers the industry’s most comprehensive search and waveform navigation with its innovative Wave Inspector® controls. These controls speed panning and zooming through your record. With a unique force-feedback system, you can move from one end of your record to the other in just seconds. User marks allow you to mark any location that you may want to reference later for further investigation. Or, automatically search your record for criteria you define. Wave Inspector will instantly search your entire record, including analog, digital, and serial bus data. Along the way it will automatically mark every occurrence of your defined event so you can quickly move between events. 
Analyze – FFT analysis of a pulsed signal. A comprehensive set of integrated analysis tools speeds verification of your design’s performance. AnalyzeVerifying that your prototype’s performance matches simulations and meets the project’s design goals requires analyzing its behavior. Tasks can range from simple checks of rise times and pulse widths to sophisticated power loss analysis and investigation of noise sources. The MSO/DPO2000 Series offers a comprehensive set of integrated analysis tools including waveform- and screen-based cursors, 29 automated measurements, and FFT analysis. Specialized application support for serial bus analysis is also available. For extended analysis, National Instrument’s LabVIEW SignalExpress™ Tektronix Edition provides over 200 built-in functions including time and frequency domain analysis, limit testing, data logging, and customizable reports. 
Wave Inspector controls provide unprecedented efficiency in viewing, navigating, and analyzing waveform data. Zip through your 1 Mpoint record by turning the outer pan control (1). Get from the beginning to end in seconds. See something of interest and want to see more details? Just turn the inner zoom control (2). Wave Inspector® Navigation and SearchA 1 Mpoint record length represents thousands of screens of information. The MSO/DPO2000 Series enables you to find your event in seconds with Wave Inspector, the industry’s best tool for navigation and search. Wave Inspector offers the following innovative controls: Zoom/PanA dedicated, two-tier front-panel control provides intuitive control of both zooming and panning. The inner control adjusts the zoom factor (or zoom scale); turning it clockwise activates zoom and goes to progressively higher zoom factors, while turning it counterclockwise results in lower zoom factors and eventually turning zoom off. No longer do you need to navigate through multiple menus to adjust your zoom view. The outer control pans the zoom box across the waveform to quickly get to the portion of waveform you are interested in. The outer control also utilizes force-feedback to determine how fast to pan on the waveform. The farther you turn the outer control, the faster the zoom box moves. Pan direction is changed by simply turning the control the other way. Play/PauseA dedicated Play/Pause front-panel button scrolls the waveform across the display automatically while you look for anomalies or an event of interest. Playback speed and direction are controlled using the intuitive pan control. Once again, turning the control further makes the waveform scroll faster and changing direction is as simple as turning the control the other way. 
Search step 1: You define what you would like to find. 
Search step 2: Wave Inspector automatically searches through the record and marks each event with a hollow white triangle. You can then use the Previous and Next buttons to jump from one event to the next. User MarksPress the Set Mark front-panel button to place one or more marks on the waveform. Navigating between marks is as simple as pressing the Previous (←) and Next (→) buttons on the front panel. Search MarksThe Search button allows you to automatically search through your long acquisition looking for user-defined events. All occurrences of the event are highlighted with search marks and are easily navigated to, using the front-panel Previous (←) and Next (→) buttons. Search types include edge, pulse width/glitch, runt, logic, setup and hold, rise/fall time parallel bus, and I2C, SPI, CAN, LIN, and RS-232/422/485/UART packet content. 
Digital phosphor technology enables a 5,000 wfm/s waveform capture rate and real-time intensity grading on the MSO/DPO2000 Series. Digital Phosphor TechnologyThe MSO/DPO2000 Series’ digital phosphor technology provides you with fast insight into the real operation of your device. Its waveform capture rate of 5,000 wfm/s gives you a high probability of quickly seeing the infrequent problems common in digital systems: runt pulses, glitches, timing issues, and more. Waveforms are superimposed with one another and waveform points that occur more frequently are intensified. This quickly highlights the events that over time occur more often or, in the case of infrequent anomalies, occur less often. With the MSO/DPO2000 Series, you can choose infinite persistence or variable persistence, determining how long the previous waveform acquisitions stay on-screen. This allows you to determine how often an anomaly is occurring. 
The MSO Series provides 16 integrated digital channels enabling you to view and analyze time-correlated analog and digital signals. Mixed Signal Design and Analysis(MSO Series)The MSO2000 Series Mixed Signal Oscilloscopes provide 16 digital channels. These channels are tightly integrated into the oscilloscope's user interface, simplifying operation and making it possible to solve mixed-signal issues easily. 
With the color-coded digital waveform display, groups are created by simply placing digital channels together on the screen, allowing the digital channels to be moved as a group. You can set threshold values for each pod of eight channels, enabling support for up to two different logic families. Color-coded Digital Waveform DisplayThe MSO2000 Series has redefined the way you view digital waveforms. One common problem shared by both logic analyzers and mixed-signal oscilloscopes is determining if data is a one or a zero when zoomed in far enough that the digital trace stays flat all the way across the display. The MSO2000 Series has color-coded digital traces, displaying ones in green and zeros in blue. 
White edges indicate additional information is available by acquiring at a higher sample rate. The multiple transition detection hardware of the MSO2000 Series will show you a white edge on the display when the system detects multiple transitions. This acts as a visual reminder that increasing the sample rate on the next acquisition will reveal higher frequency information than your previous settings could acquire. The MSO2000 Series simplifies channel setup by allowing you to group digital waveforms and enter waveform labels by using a USB keyboard. By simply placing digital waveforms next to each other, they form a group. Once a group is formed, you can position all the channels contained in that group collectively. This greatly reduces the normal setup time associated with positioning channels individually. 
The P6316 MSO probe offers two eight-channel pods to simplify connecting to your device. P6316 MSO ProbeThis unique probe design offers two eight-channel pods, simplifying the process of connecting to the device-under-test. When connecting to square pins, the P6316 can connect directly to 8×2 square pin headers spaced on tenth-inch centers. When more attachment flexibility is required, you can use the included flying lead sets and grabbers to clip onto surface mount devices or test points. The P6316 offers outstanding electrical characteristics applying only 8 pF of capacitive loading with 101 kΩ input impedance. 
Output of DAC Signal – Notice how FilterVu™ clearly shows the noise-free steps of the DAC in the foreground trace (yellow) which has removed all frequencies above 5.5 kHz. FilterVu also captures and displays high-frequency glitches up to the full bandwidth of the oscilloscope in the background trace (orange). FilterVu™ Variable Low-pass FilterTired of being limited to a 20 MHz bandwidth filter in your oscilloscope? Simply turn on FilterVu and adjust the variable low-pass noise filter. Unlike other variable low-pass filters, FilterVu filters out the unwanted noise from your signal while still capturing glitches and other signal details up to the full bandwidth of the oscilloscope. It does this by showing two waveforms: a waveform that can be filtered (foreground waveform) and a glitch capture waveform (background waveform). The filtered waveform uses a variable low-pass filter to block out noise, yielding a cleaner waveform to more precisely locate signal edges and amplitude levels. The result is improved confidence in you cursor measurements and cleaner documentation of important signal attributes. When the noise filter is adjusted to the lowest available noise-cutoff frequency, no more than 1% of high-frequency content that could cause the oscilloscope to alias will pass through the filter. The glitch capture waveform shows signal details up to the full bandwidth of the oscilloscope. The oscilloscope captures pulses as narrow as 5 ns, using peak-detect min/max sampling, protecting you from missing unexpected glitches or other high-frequency events. FilterVu is ideal for repetitive, nonrepetitive, and single-shot events. 
Triggering on a specific data packet going across an I2C bus. The yellow waveform is clock and the blue waveform is data. A bus waveform provides decoded packet content including Start, Address, Read/Write, Data, and Stop. Serial Triggering and Analysis (Optional)On a serial bus, a single signal often includes address, control, data, and clock information. This can make isolating events of interest difficult. The MSO/DPO2000 Series offers a robust set of tools for debugging serial buses with automatic trigger, decode, and search for I2C, SPI, CAN, LIN, and RS-232/422/485/UART. Serial TriggeringTrigger on packet content such as start of packet, specific addresses, specific data content, unique identifiers, etc. on popular serial interfaces such as I2C, SPI, CAN, LIN, and RS-232/422/485/UART. Bus DisplayProvides a higher-level, combined view of the individual signals (clock, data, chip enable, etc.) that make up your bus, making it easy to identify where packets begin and end and identifying subpacket components such as address, data, identifier, CRC, etc. Bus DecodingTired of having to visually inspect the waveform to count clocks, determine if each bit is a 1 or a 0, combine bits into bytes, and determine the hex value? Let the oscilloscope do it for you! Once you’ve set up a bus, the MSO/DPO2000 Series will decode each packet on the bus, and display the value in hex, binary, decimal (LIN only), or ASCII (RS-232/422/485/UART only) in the bus waveform. 
Event table showing decoded Identifier, DLC, DATA, and CRC for every CAN packet in a long acquisition. Event TableIn addition to seeing decoded packet data on the bus waveform itself, you can view all captured packets in a tabular view much like you would see in a software listing. Packets are time stamped and listed consecutively with columns for each component (Address, Data, etc.). SearchSerial triggering is very useful for isolating the event of interest, but once you’ve captured it and need to analyze the surrounding data, what do you do? In the past, users had to manually scroll through the waveform counting and converting bits and looking for what caused the event. With the MSO/DPO2000 Series, you can have the oscilloscope automatically search through the acquired data for user-defined criteria including serial packet content. Each occurrence is highlighted by a search mark. Rapid navigation between marks is as simple as pressing the Previous (←) and Next (→) buttons on the front panel. Designed to Make Your Work Easier
The MSO/DPO2000 is designed to make your work easier. The bright, widescreen display shows a long time window. Dedicated front-panel controls simplify operation. A USB host port on the front panel allows you to easily transfer screenshots, instrument settings, and waveform data to a memory stick. Bright, Widescreen DisplayThe MSO/DPO2000 Series features a 7 inch (180 mm) widescreen, TFT-LCD display for seeing intricate signal details. Dedicated Front-panel ControlsPer-channel vertical controls provide simple and intuitive operation. No longer do you need to share one set of vertical controls across all four channels. ConnectivityA USB host port on the front panel enables easy transfer of screenshots, instrument settings, and waveform data to a USB thumb drive. The rear panel contains a USB device port for controlling the oscilloscope remotely from a PC or for connecting a USB keyboard. The USB device port can also be used to print directly to a PictBridge®-compatible printer. An optional 10/100 Ethernet port enables easy connection to networks and an optional Video Out port allows the oscilloscope display to be exported to an external monitor or projector. 
The MSO/DPO2000 Series’ compact form factor frees up valuable space on your bench or desktop. Compact Form FactorA compact, portable form factor allows the MSO/DPO2000 Series to be easily moved between labs and, with a depth of just 5.3 inches (134 mm), it saves you valuable space on your test bench. 
TekVPI probe interface simplifies connecting your probes to the oscilloscope. TekVPI® Probe InterfaceThe TekVPI probe interface sets the standard for ease of use in probing. TekVPI probes feature status indicators and controls, as well as a probe menu button right on the comp box itself. This button brings up a probe menu on the oscilloscope display with all relevant settings and controls for the probe. TekVPI probes can be controlled remotely through USB, GPIB, or Ethernet, enabling more versatile solutions in ATE environments. 
NI LabVIEW SignalExpress™ Tektronix Edition is a fully interactive measurement acquisition and analysis software developed jointly with National Instruments and optimized for the MSO/DPO Series. 
OpenChoice® Desktop software enables seamless connection between the oscilloscope and your PC. Extended AnalysisAcquiring data and measurements from the MSO/DPO2000 Series is as simple as connecting a USB cable from the oscilloscope to your PC. Key software applications – NI LabVIEW SignalExpress™ Tektronix Edition LE, OpenChoice® Desktop, and Microsoft Excel and Word toolbars – are included standard with each oscilloscope to enable fast and easy direct communication with your Windows PC. NI LabVIEW SignalExpress Tektronix Edition LE enables you to instantly acquire, generate, analyze, compare, import, and save measurement data and signals using an intuitive drag-and-drop user interface that does not require any programming. The optional Professional Version offers over 200 built-in functions that provide additional signal processing, advanced analysis, sweeping, limit testing, and user-defined step capabilities. For simple tasks, the included OpenChoice Desktop enables fast and easy communication between the oscilloscope and your PC through USB, GPIB, or LAN for transferring settings, waveforms, and screen images. CharacteristicsVertical System Analog Channels
|